Survey Results Out: What Students Said about Technology at UIC
Introduction
We are happy to share with you the results of a survey delving into undergraduate student use of, and satisfaction with technology services, tools, and resources at UIC.
Based on a 2023 EDUCAUSE survey which engaged several institutions across the U.S., our report offers insight into the hybrid course experience, technology-related service satisfaction, feedback on internet connectivity, and more.
Additionally, it examines technology’s dual role as a catalyst and barrier in students’ educational paths.
About the survey
The student experience with academic technology is important to UIC. At Technology Solutions, we focus on transforming the UIC digital experience for students and their success by delivering secure, modern, value-driven technology infrastructure and services to enable learning and research. One of the ways we gather feedback and data on the student experience with technology is through surveys.
In 2023, we deployed a survey created by EDUCAUSE, which aimed to explore what it means to be a student amidst the waning pandemic and enduring global uncertainties. The survey’s goal was to gather the data necessary to better understand evolving educational needs from the undergraduate student perspective. Additionally, it examined technology’s dual role as a catalyst and barrier in students’ educational paths.
A total of 1,951 undergraduate students from across 10 U.S. institutions partook in the 2023 EDUCAUSE Survey. A total of 370, or some 19% of those respondents were UIC students. This report includes key findings on IT-related topics from data collected from UIC undergraduate students.
At a Glance
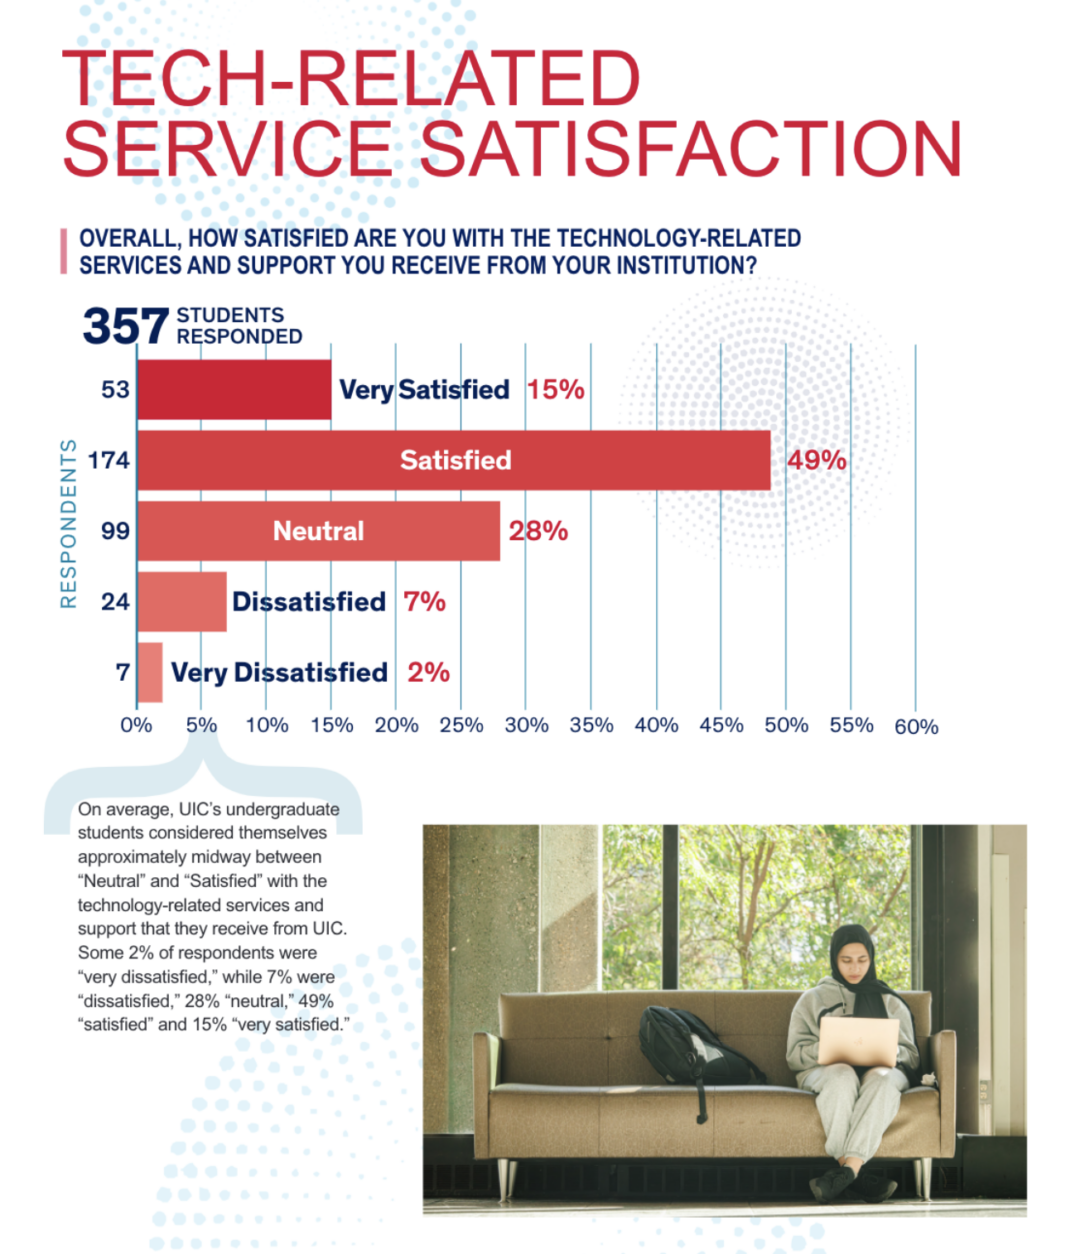
- When it comes to technology services, some 15% of student respondents were “very satisfied,” 49% “satisfied,” 28% “neutral,” 7% “dissatisfied,” and 2% “very dissatisfied.”
- On average, UIC’s undergraduate students considered themselves approximately midway between “Neutral” and “Satisfied” with the technology-related services and support that they receive from UIC.
- A total of 37 respondents – about 11% of the 346 students indicated they have a disability or impairment. Of those, 11 indicated a need for accessible content, tech, or tech accommodation.
- Of 281 respondents, some 7% of students noted “printing” as something that can improve the technology-related services and support they are receiving. Of those 19 students, 47% mentioned printer performance including issues such as machine downtime and lack of paper, while 26% suggested adding more printers throughout campus, and 21% mentioned printing fees.
At a glace 2
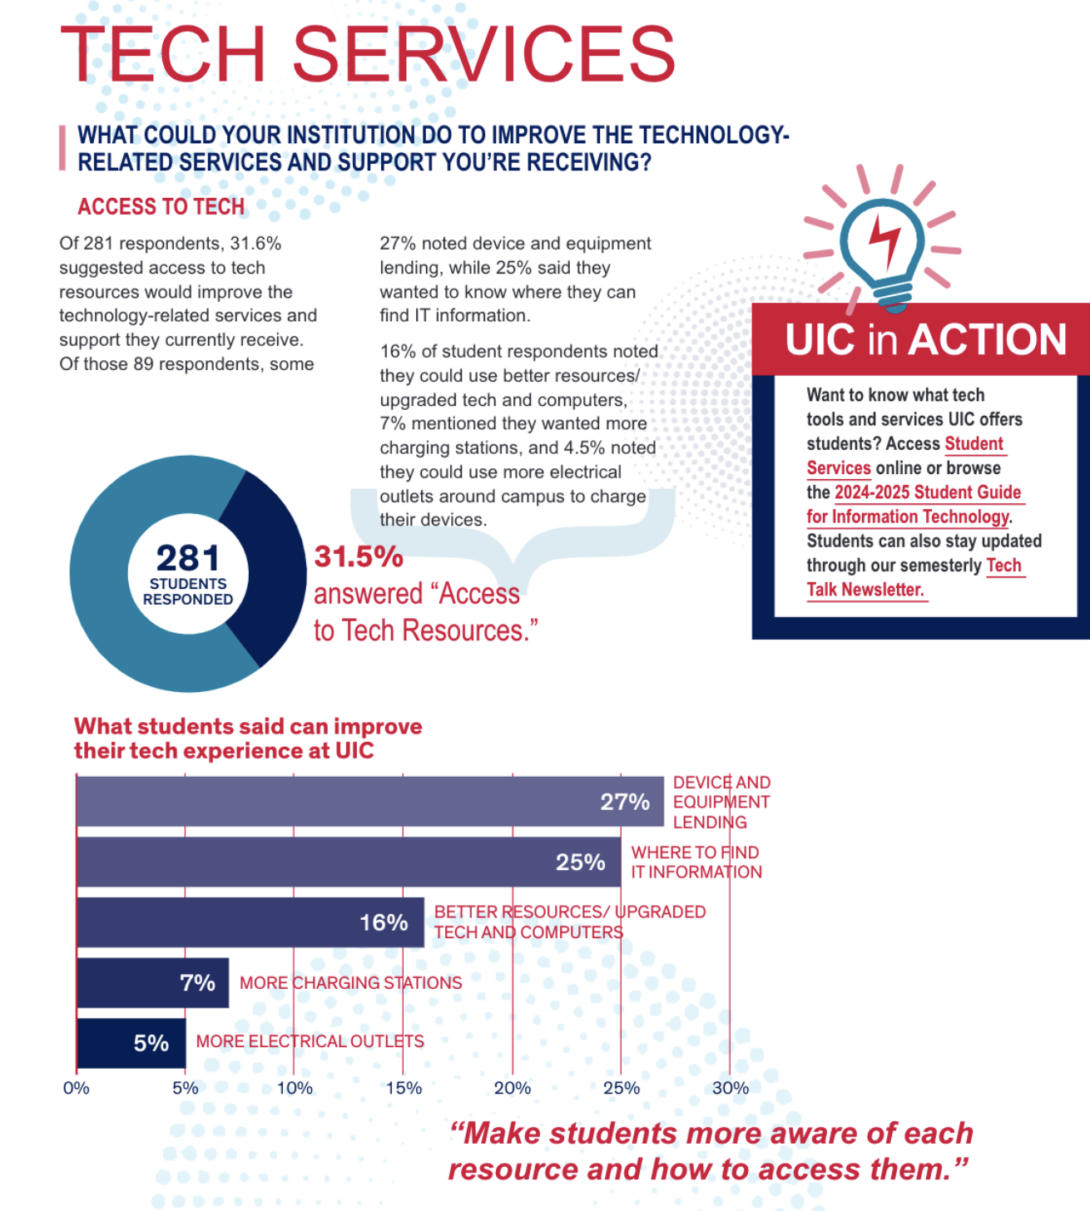
- Of 281 respondents, 31.6% suggested access to tech resources would improve the technology-related services and support they currently receive.
- Of those 89 respondents, some 27% noted device and equipment lending, while 25% said they wanted to know where they can find IT information.
- Of those 89 students, some 16% noted they could use better resources/upgraded tech and computers, 7% mentioned they wanted more charging stations, and 4.5% noted they could use more electrical outlets around campus to charge their devices.
Curious to see what UIC students said about technology services at UIC?
Click on the link below to download the 2023 Report on Student use of technology at UIC.
Access the Full Report
Your feedback matters
To best serve student needs, Technology Solutions actively engages in feedback gathering. In addition to annual or one-time surveys such as the one by EDUCAUSE, we more frequently collect feedback through other surveys.
If you receive an invitation from us, with the subject line “Your Recent Help Request,” please complete our 8-question evaluation form. Unless you choose to submit a long comment, you can easily answer the whole survey in less than three minutes.